Reseller Inventory Spreadsheet
Reseller Profit & Fee Tracker · Flipping Tracker
View on Etsy- Excel + Google Sheets
- Instant download
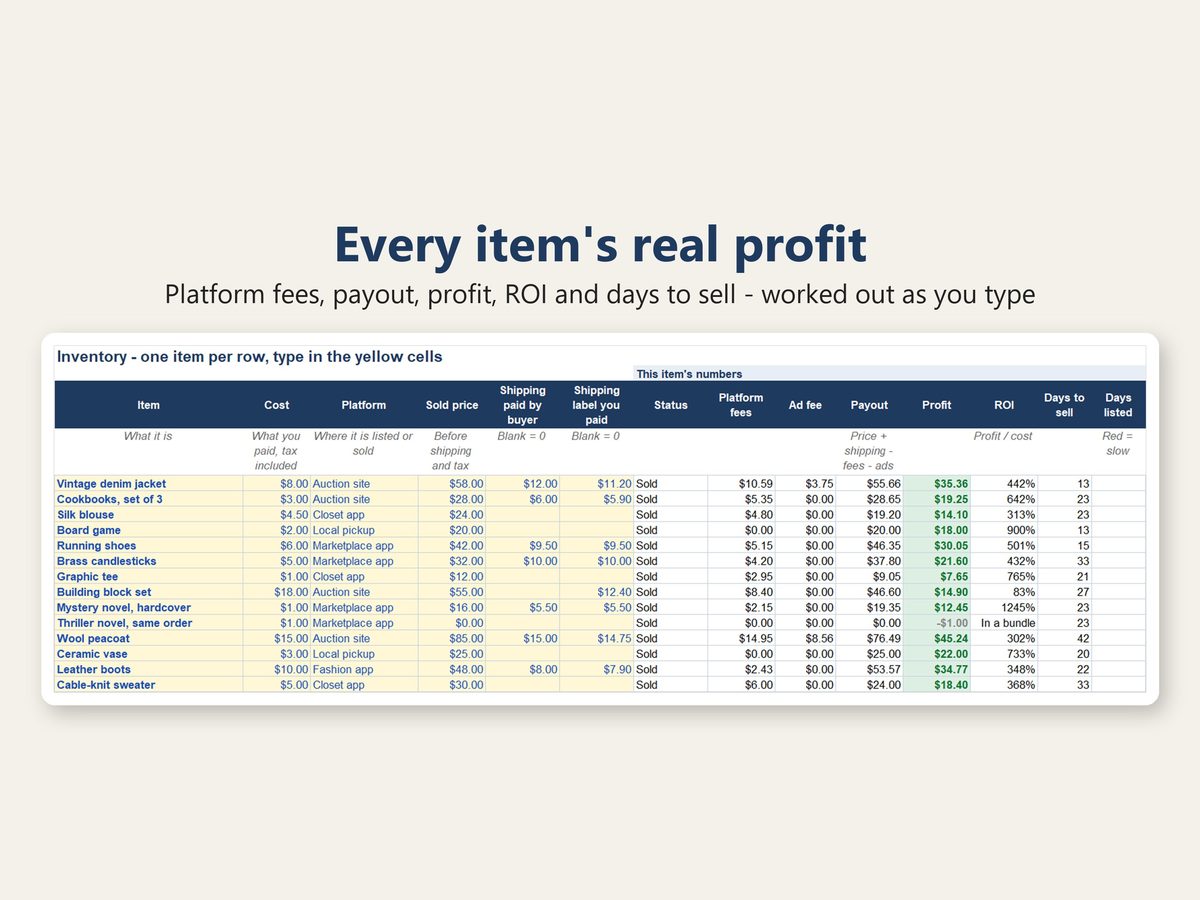
Know what every item really made after platform fees, shipping labels and packing – and which platform leaves you the most for the same item.
For resellers who buy at thrift stores, garage sales, estate sales and the bins and sell clothing, shoes, books, toys, home decor or furniture online or locally – side hustle or full time. Set each platform's fee rule once, then log each item as you buy, list and sell it. Every row shows the item's fees, payout, profit, ROI and days to sell, and the summary tabs show which platforms, categories and sources pay best – and how much money is tied up in unsold stock.
WHAT IT ANSWERS
- What did this item really make after the platform's fees, the shipping label and packing?
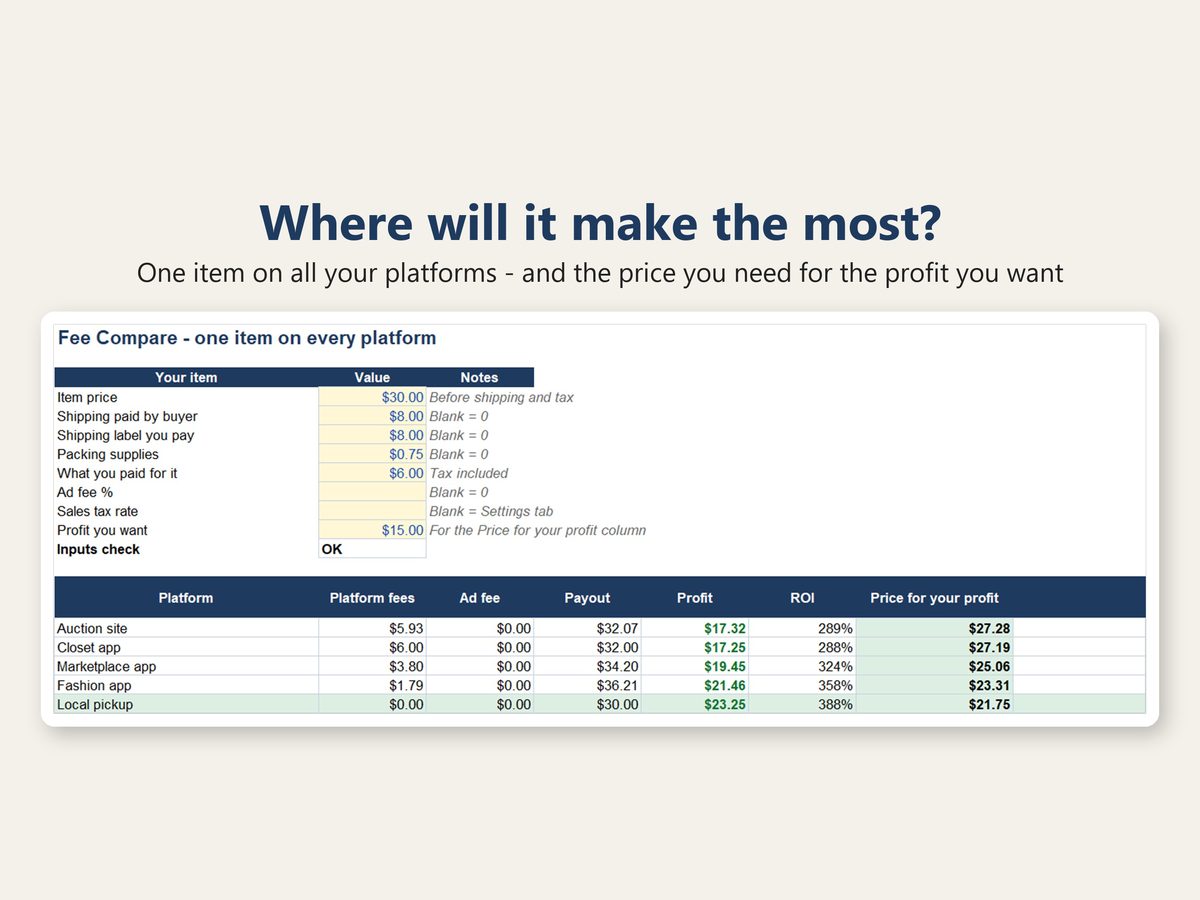
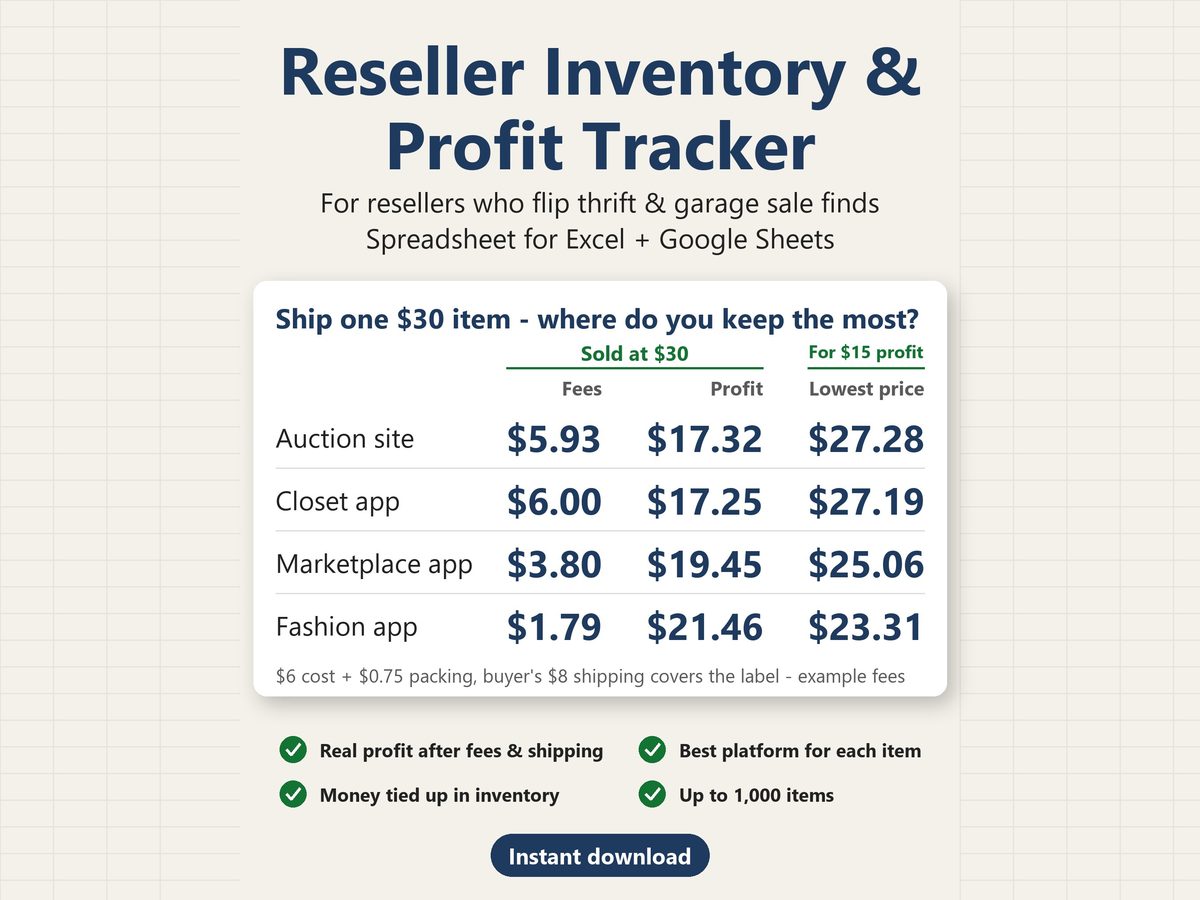
- Which platform leaves me the most for the same item – and what price do I need there for the profit I want? (the Fee Compare tab)
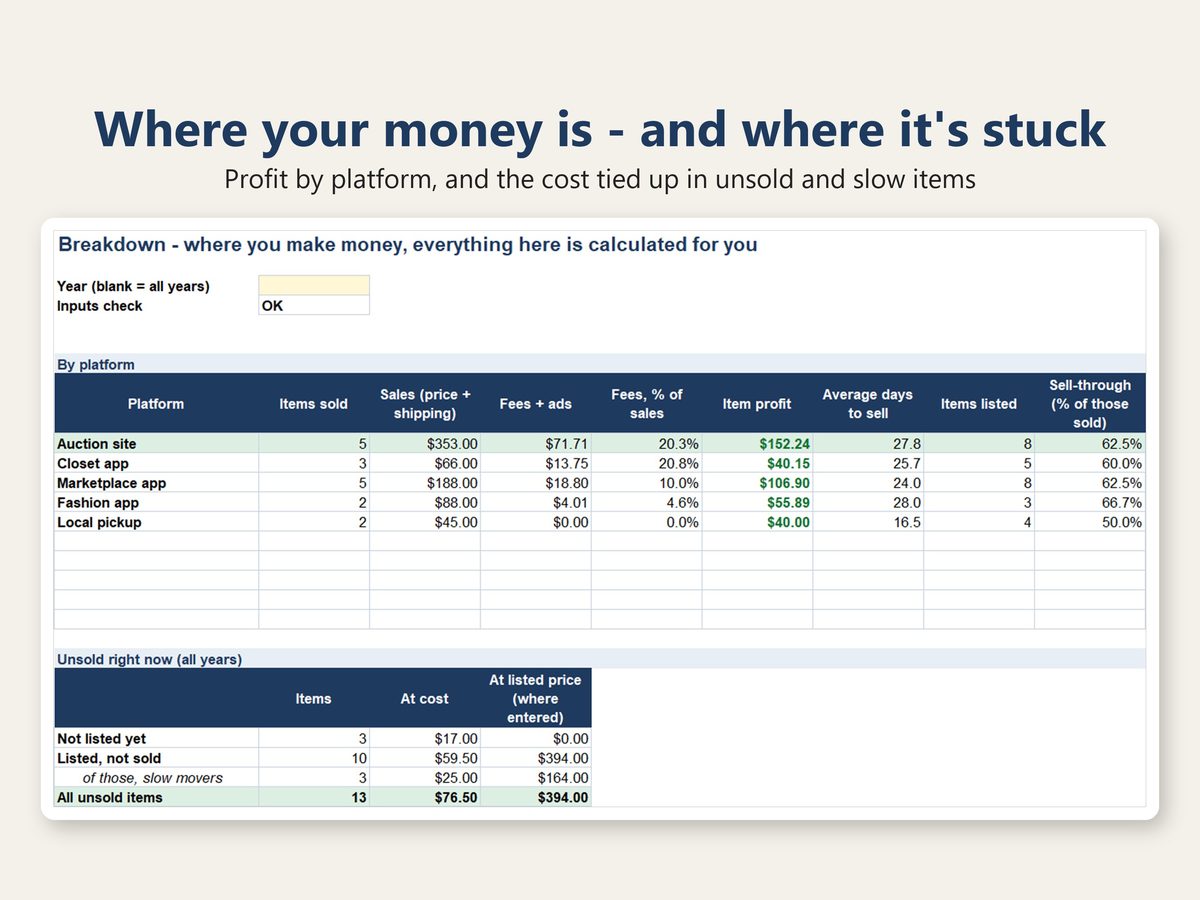
- How much money is tied up in stock I haven't listed or sold yet? Which items have sat too long?
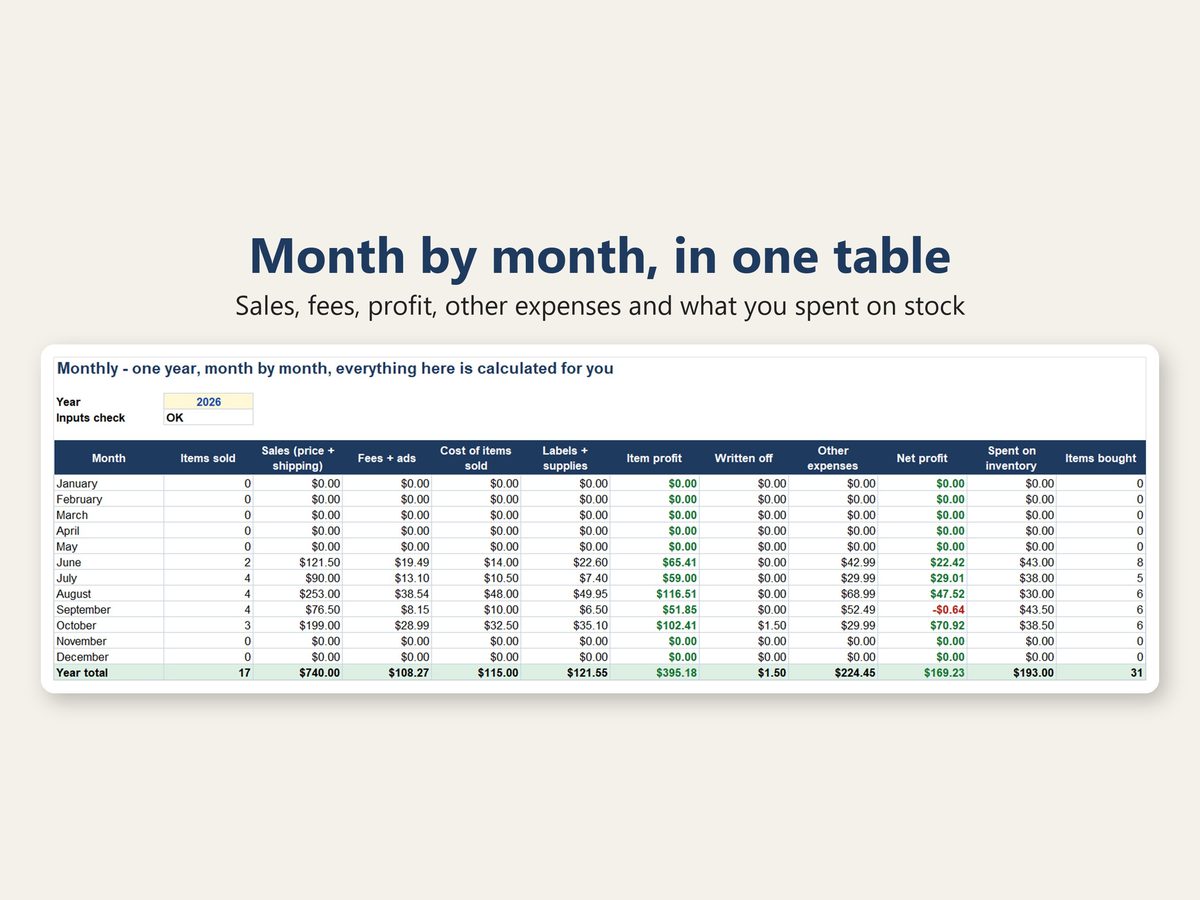
- What did I make each month after my other costs (gas, apps, tools) and the items I donated?
- Which platforms, categories and sources make the most and sell the fastest?
HOW IT WORKS
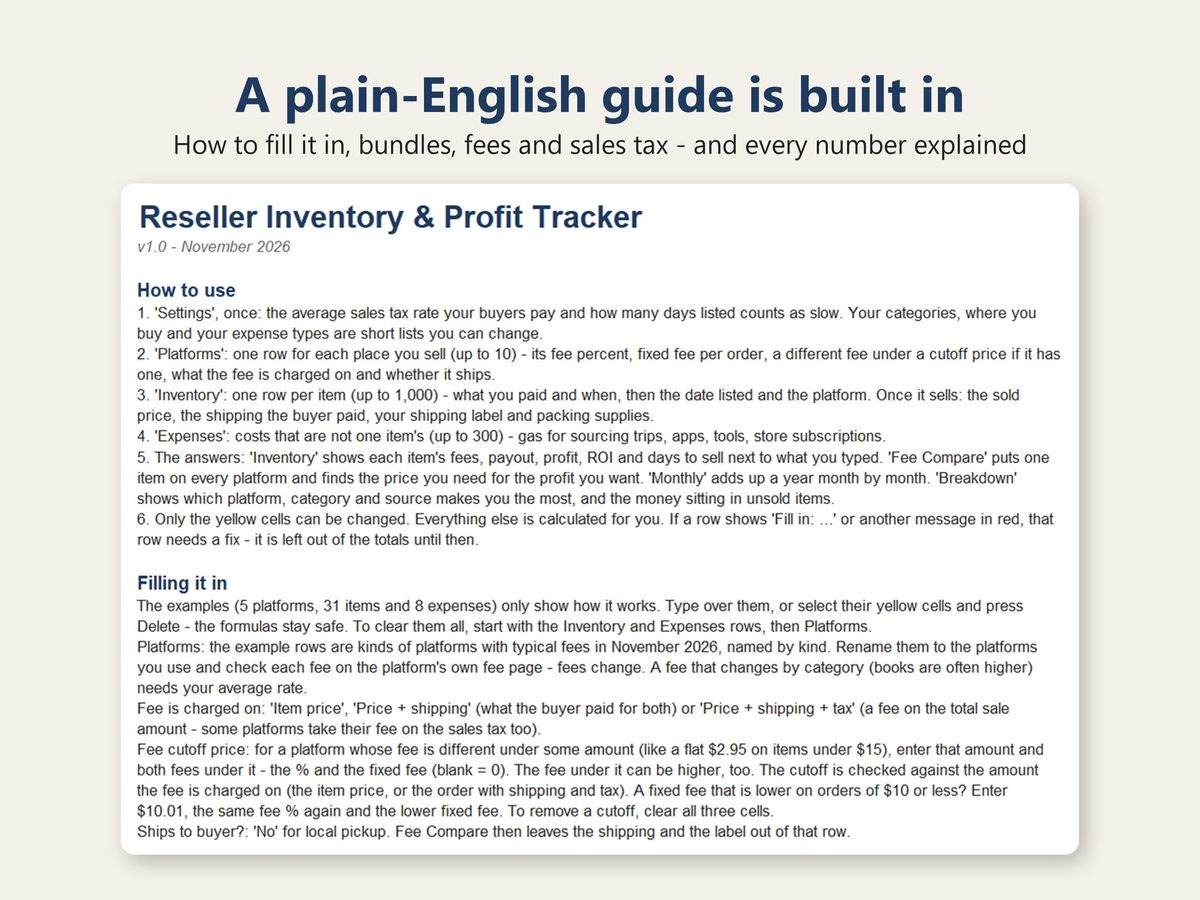
- Settings: once – the average sales tax rate your buyers pay and how many days listed counts as slow (90 to start). Your categories, where you buy and your expense types are short lists you can change.
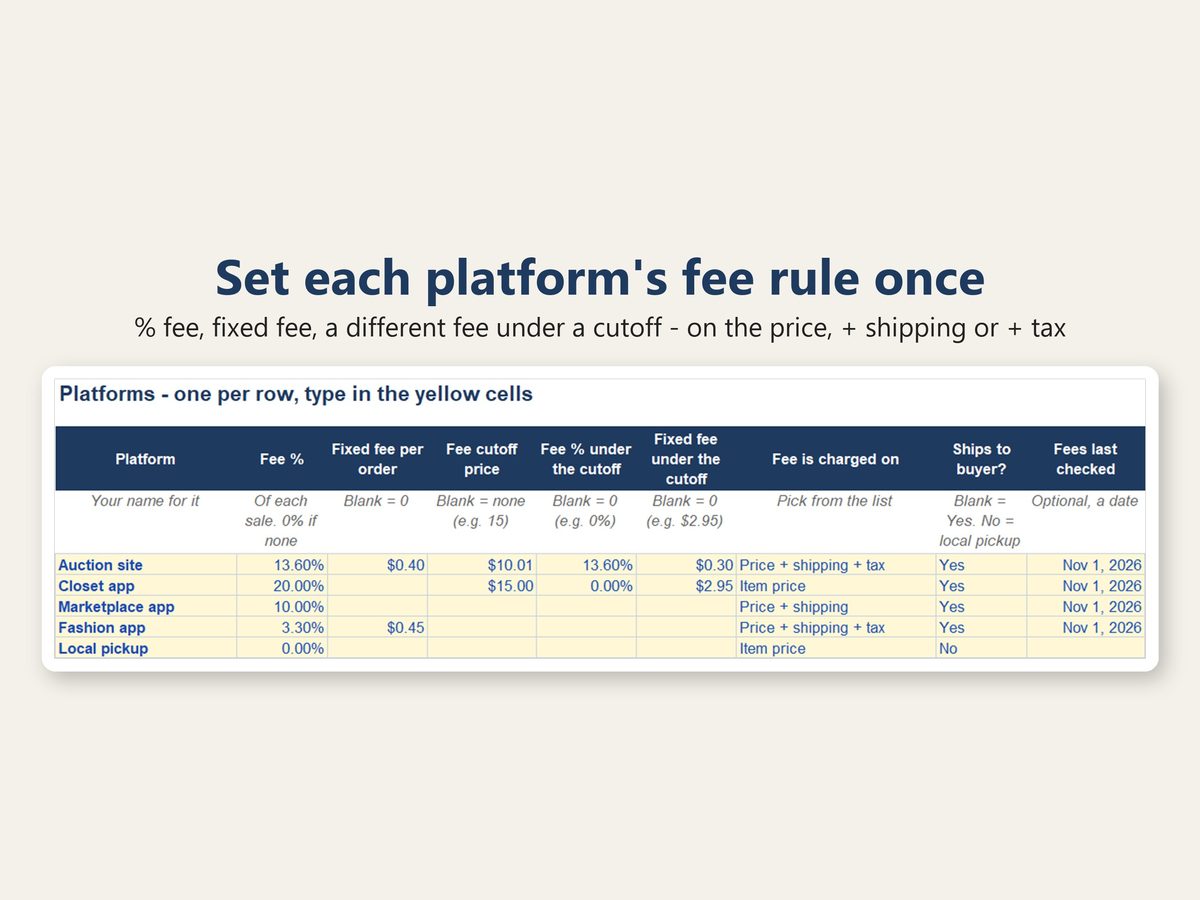
- Platforms: one row per place you sell (up to 10) – the fee %, a fixed fee per order, a different fee under a cutoff price if the platform has one (like a flat fee on cheaper items), whether the fee is charged on the item price, the price + shipping, or the total with sales tax, and whether it ships (local pickup does not).
- Inventory: one row per item (up to 1,000) – what you paid, when you bought and listed it, the platform and an optional SKU or bin number. When it sells: the sold price, the shipping the buyer paid, your label, packing supplies and any ad fee. Fees, payout, profit, ROI and days to sell appear right next to what you typed, and items listed too long turn red. Donated or tossed an item? One date takes it off your unsold stock.
- Expenses: costs that are not one item's (up to 300) – gas for sourcing trips, apps, tools, storage.
- Fee Compare: one item on every platform side by side – fees, payout, profit and ROI, the platform that leaves the most highlighted, and the price you need on each one for the profit you want.
- Monthly and Breakdown: month by month for the year you pick, then profit, fees as a % of sales, average days to sell and the sell-through rate by platform, category and source – plus what is sitting unsold, at cost and at your listed prices.
WHAT YOU GET
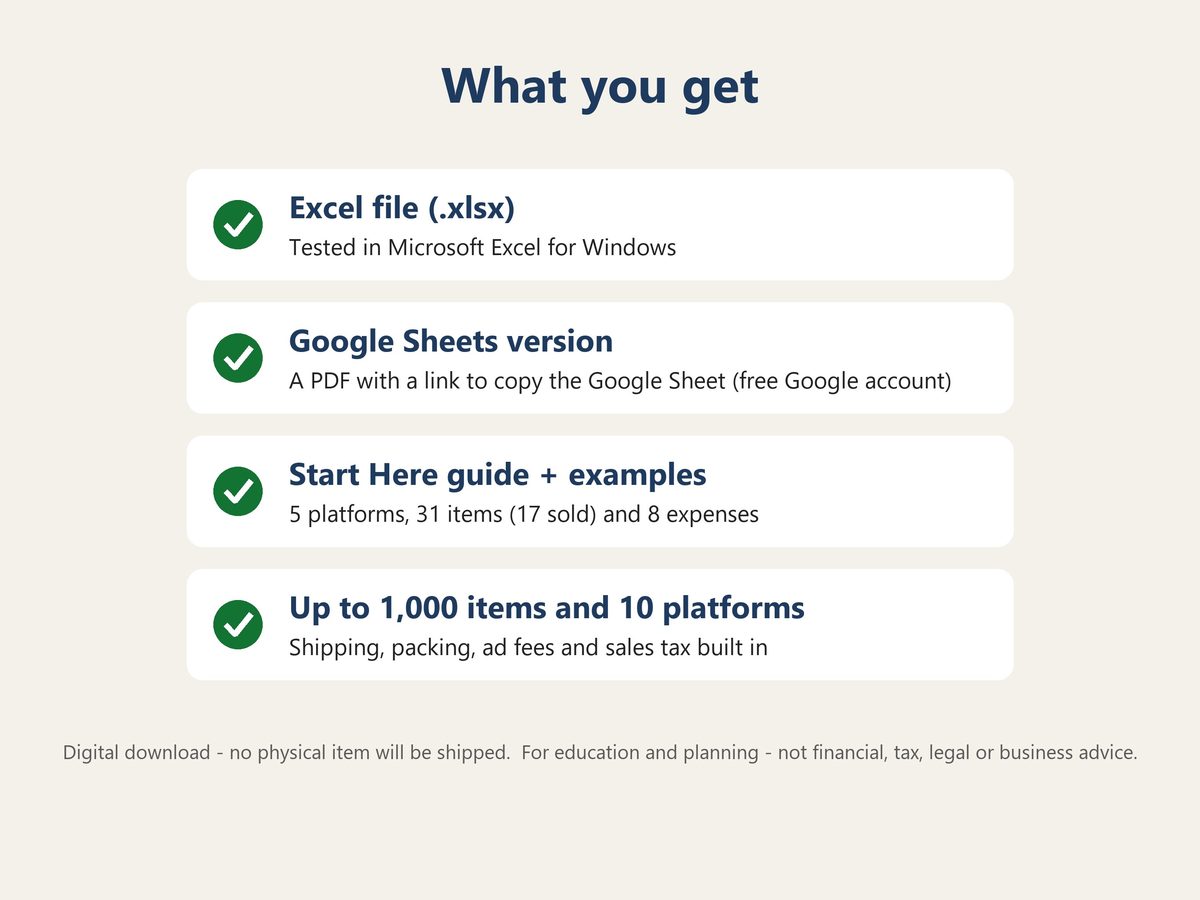
- Excel file (.xlsx), tested in Microsoft Excel for Windows – on a Mac, use the Google Sheets version
- Google Sheets version: a PDF with a link to make your own copy (use this one on a Mac or Chromebook if you do not have Excel)
- Start Here tab: step-by-step instructions and the plain-English meaning of every number (see photo 7)
- 5 example platforms, 31 example items (17 sold) and 8 example expenses – replace them with your own
GOOD TO KNOW
- The example platforms are named by kind (Auction site, Closet app, Marketplace app, Fashion app, Local pickup) with typical fees as of November 2026. Rename them to the platforms you use and check each fee on the platform's own fee page – fees change.
- Each platform gets one fee rule: a % and a fixed fee, with an optional different fee under a cutoff price. A fee that changes by category (books are often higher) or by your sales volume needs your average rate.
- Sales tax: the platform collects it for the state, so it is left out of your sales and profit. It only counts where a platform takes its fee on the tax too.
- Sold several items in one order? The order goes on the first item's row and $0 on the others, so the totals stay right. Prepaid shipping labels, returns, box lots and items listed on more than one platform are explained on the Start Here tab.
- Not counted: income tax, payout or transfer fees and mileage rates. Add costs like these on the Expenses tab.
- Amounts are in US dollars.
- Only the yellow cells can be changed, so the formulas are hard to break by accident.
- Room for 1,000 items, 10 platforms and 300 expenses. Adding more rows is not supported; when it fills up, start a fresh copy (for example, one per year).
- Made for a computer screen: the sheets are wide, and it has not been tested on a tablet or phone.
- This is a digital download. Nothing will be shipped.
- For education and planning only. This is not financial, tax, legal or business advice.
- For personal use in your own business. Please do not resell or share the file.
ABOUT THIS TEMPLATE
Designed by SlateTally with the help of AI tools. Every result was checked in Microsoft Excel against an independent calculation, including unusual inputs such as an order just under a fee cutoff, a fee charged on the sales tax, a $0 bundle row, a donated item, an item sold before it was listed, a platform name used twice, a profit no price can reach and an item on the last row. The Google Sheets version was checked cell by cell against the Excel file.
Questions? Send a message – happy to help.