Rental Property Analyzer for Real Estate Agents
Branded Client Report
View on Etsy- Excel + Google Sheets
- Instant download
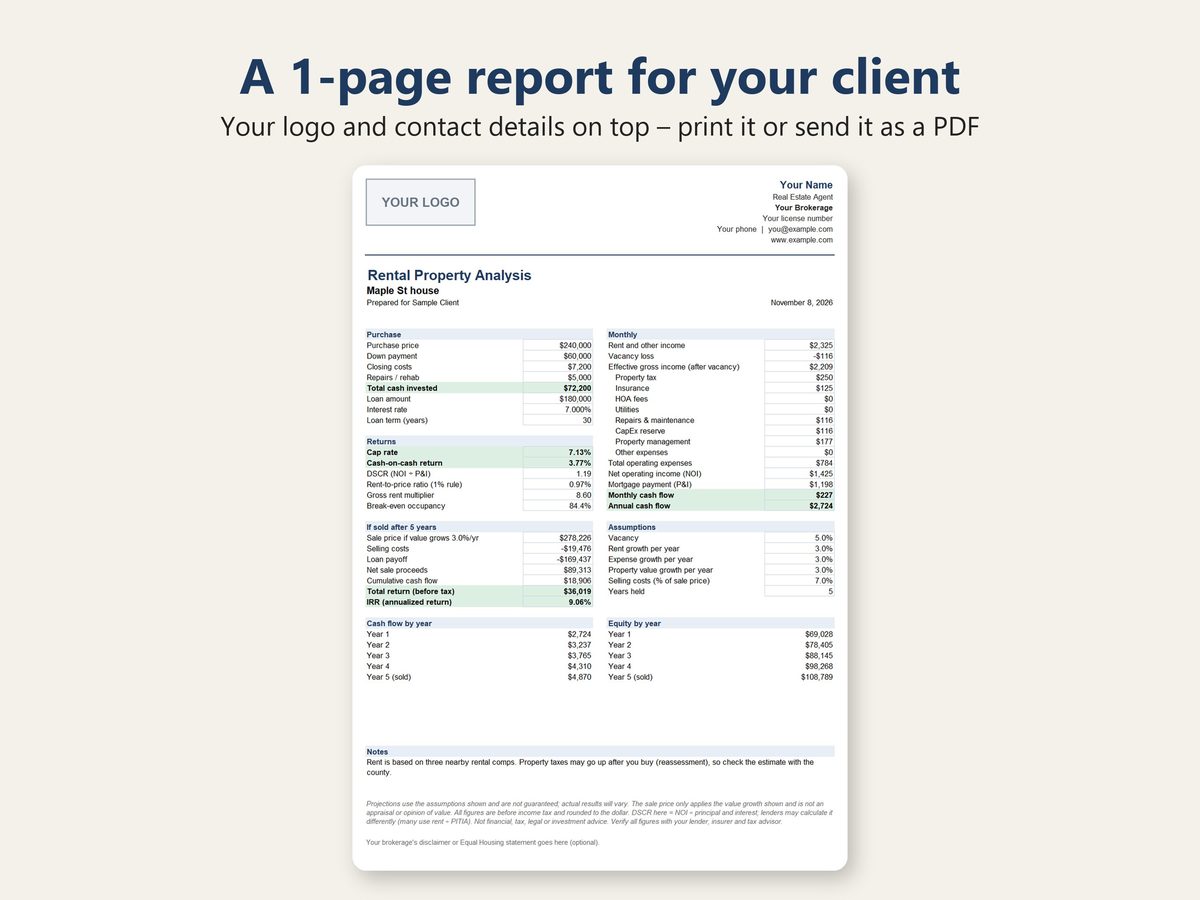
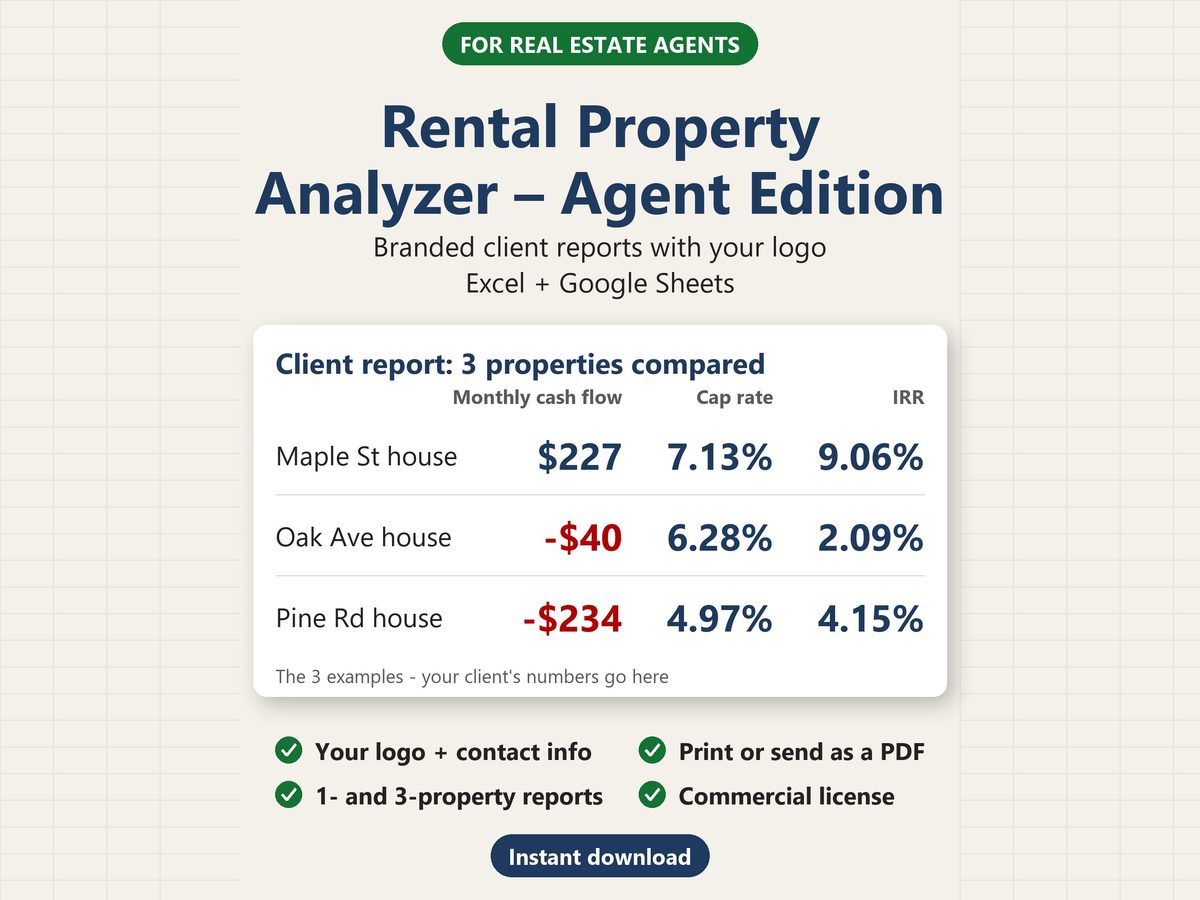
Give your investor clients a clear one-page analysis of a rental property, with your logo, name and contact details at the top.
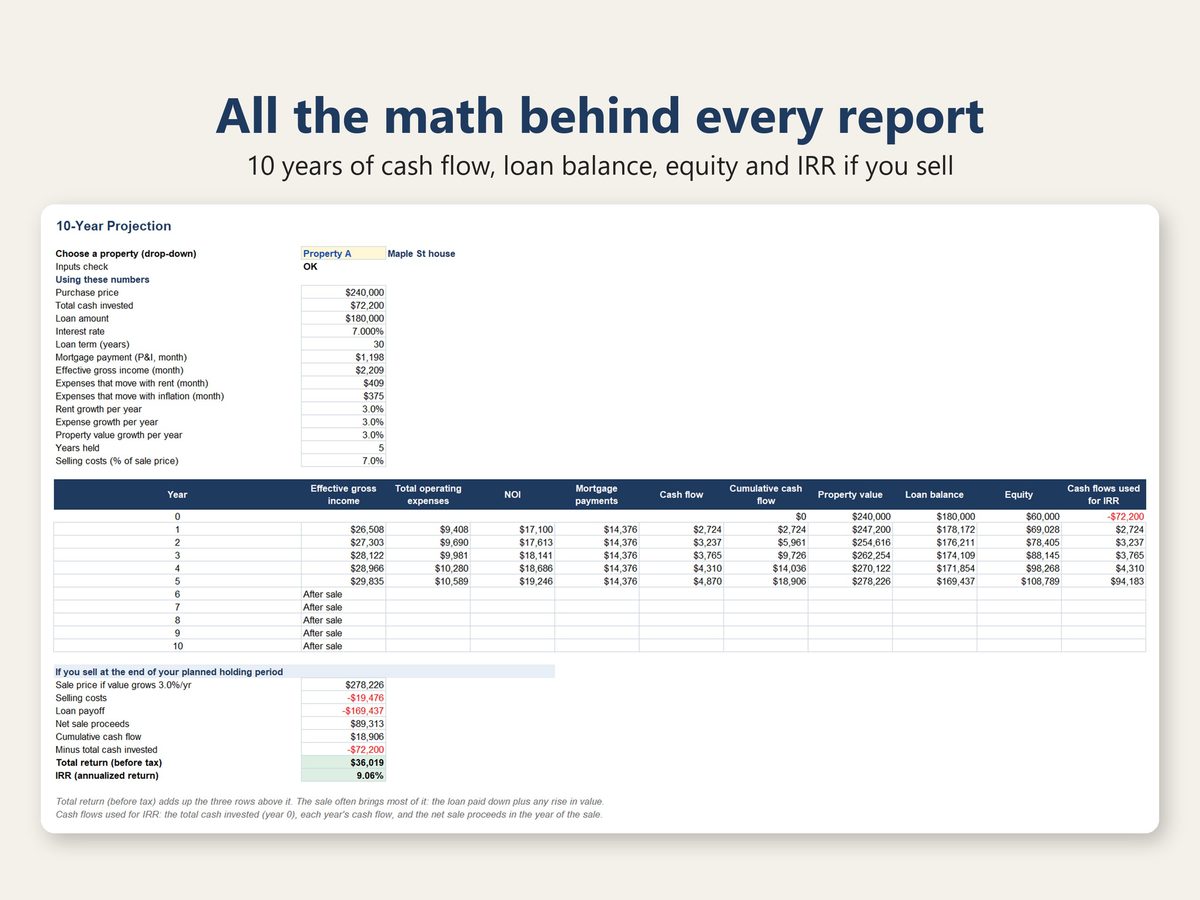
This spreadsheet turns the numbers from a listing into the answers investors and lenders look at: monthly cash flow, cap rate, cash-on-cash return, DSCR, the 1% rule, break-even occupancy, equity year by year and the projected IRR if they sell. It then lays them out on two print-ready reports you can send as a PDF.
THE TWO REPORTS
- Client Report (1 page, portrait): one property. The purchase, the monthly rent and every operating cost line by line, the returns, the sale after the years held at the value growth you enter (selling costs and loan payoff shown), cash flow and equity year by year, and a short note from you.
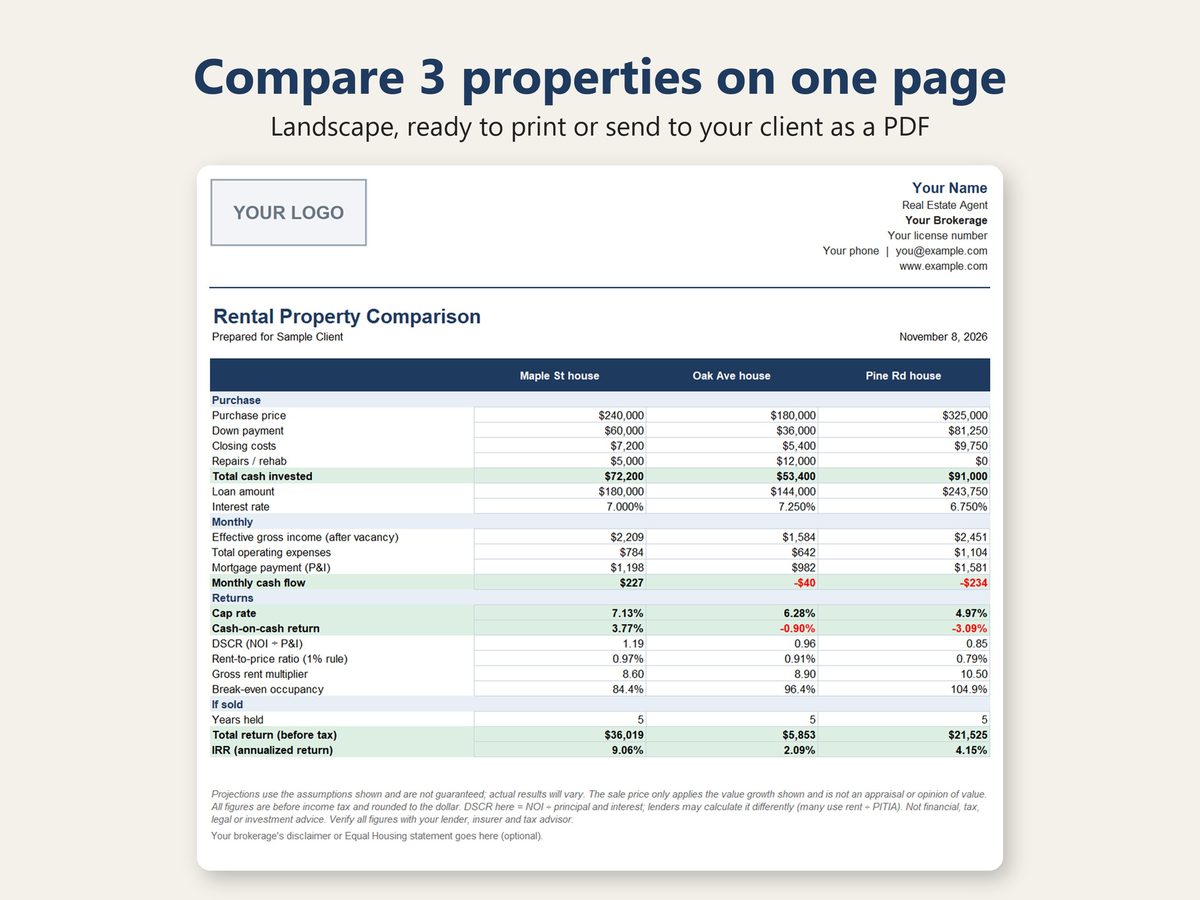
- Compare Report (1 page, landscape): up to 3 properties side by side. A warning shows when they are held for different numbers of years.
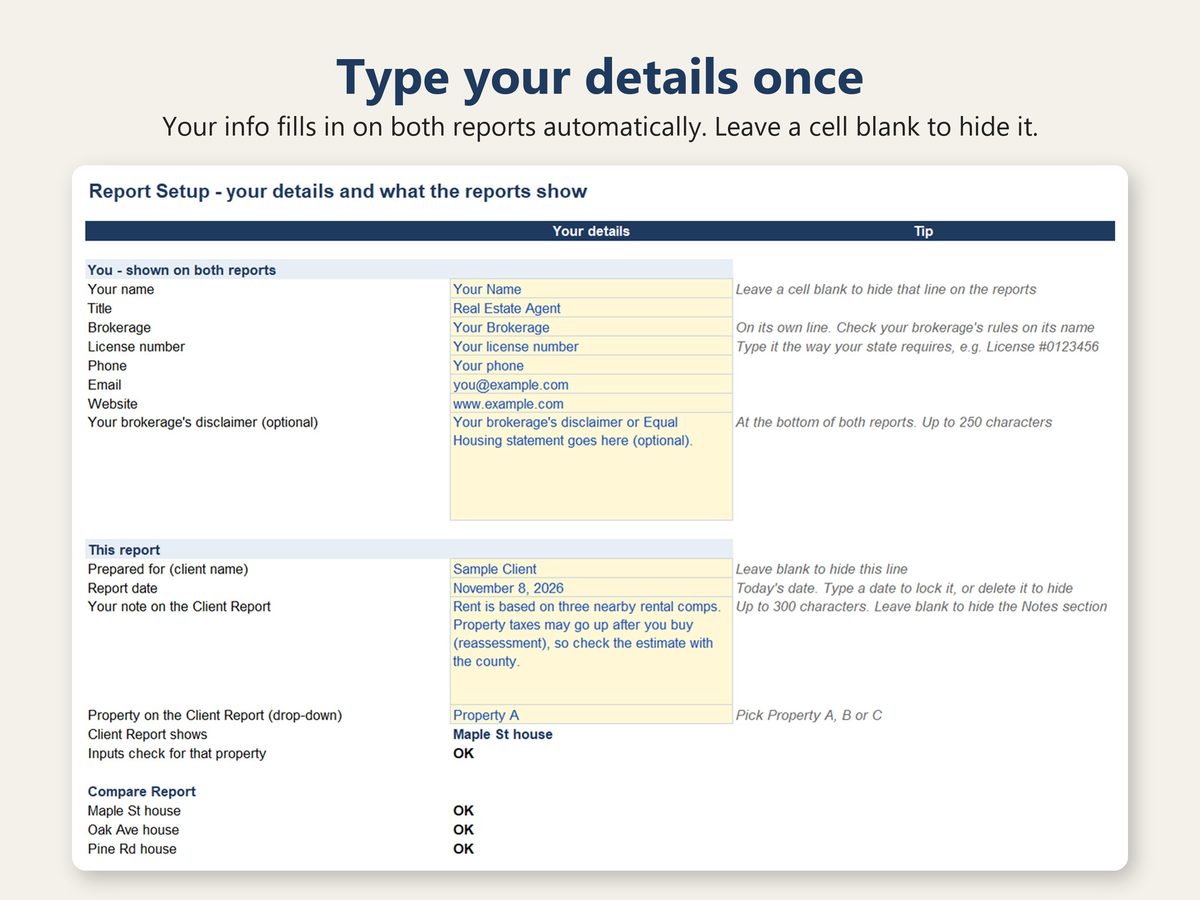
- Both show your logo, name, title, your brokerage name on its own line, license number, phone, email and website, and your brokerage's disclaimer if it requires one. Leave any of them blank and that line is hidden.
- Each report ends with a short notice: projections are not guaranteed and are not an appraisal, figures are before income tax and rounded to the dollar, how DSCR is figured here, and it is not financial advice.
HOW IT WORKS
- Report Setup: type your details once, then the client's name and an optional note.
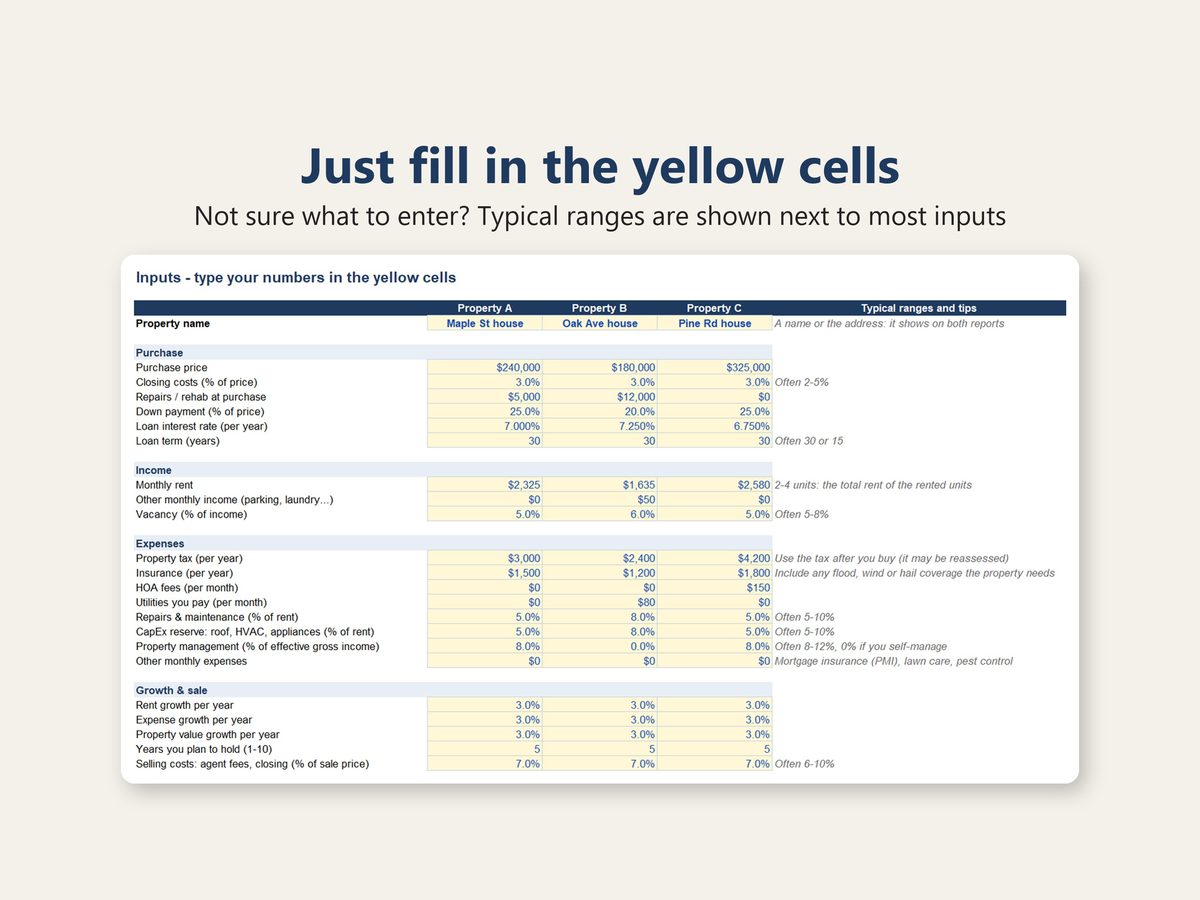
- Inputs: price, down payment, interest rate, rent, taxes, insurance, HOA, repairs and management for up to 3 properties. Typical ranges are shown next to most inputs.
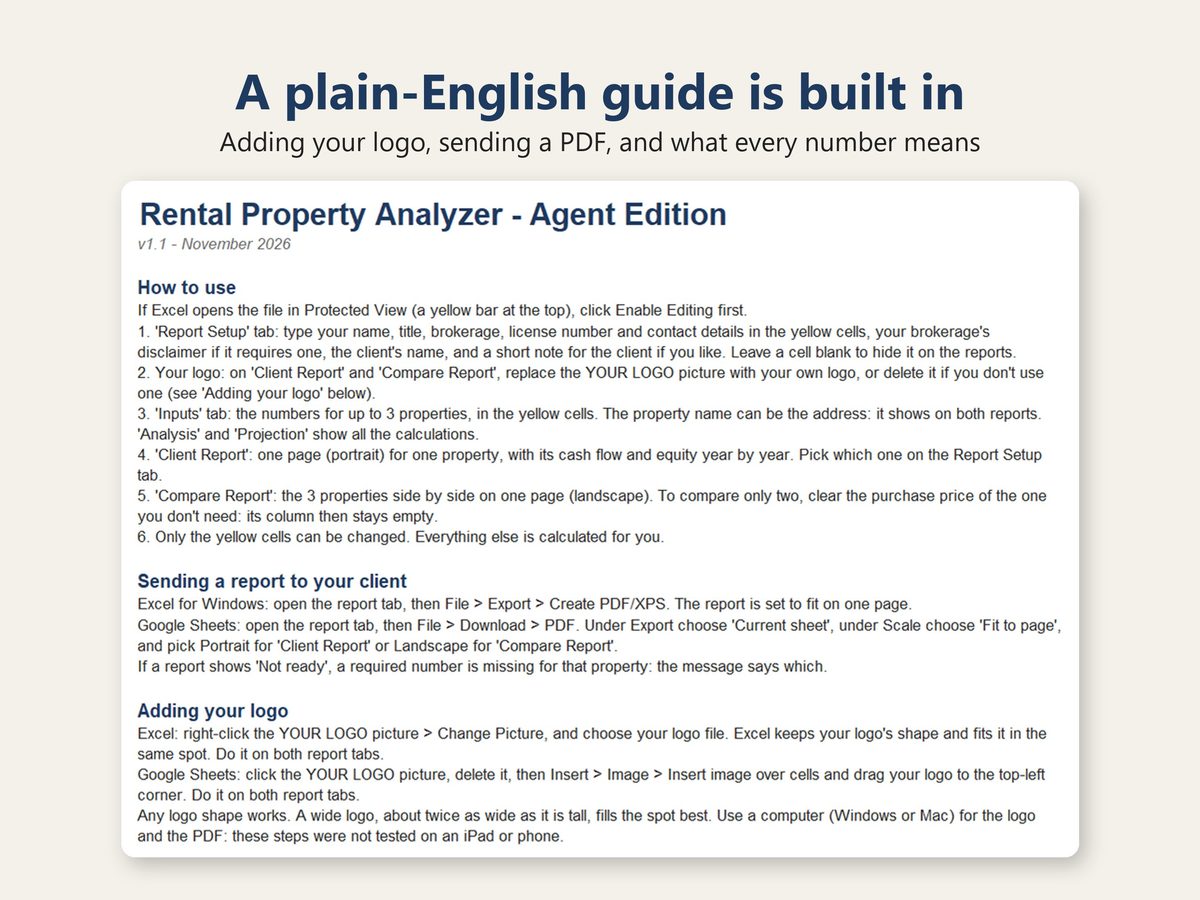
- Replace the YOUR LOGO picture with your own logo (the guide shows how in Excel and in Google Sheets).
- Pick the property for the Client Report, then save the report as a PDF or print it. Each report is set to fit on one US Letter page.
LICENSE
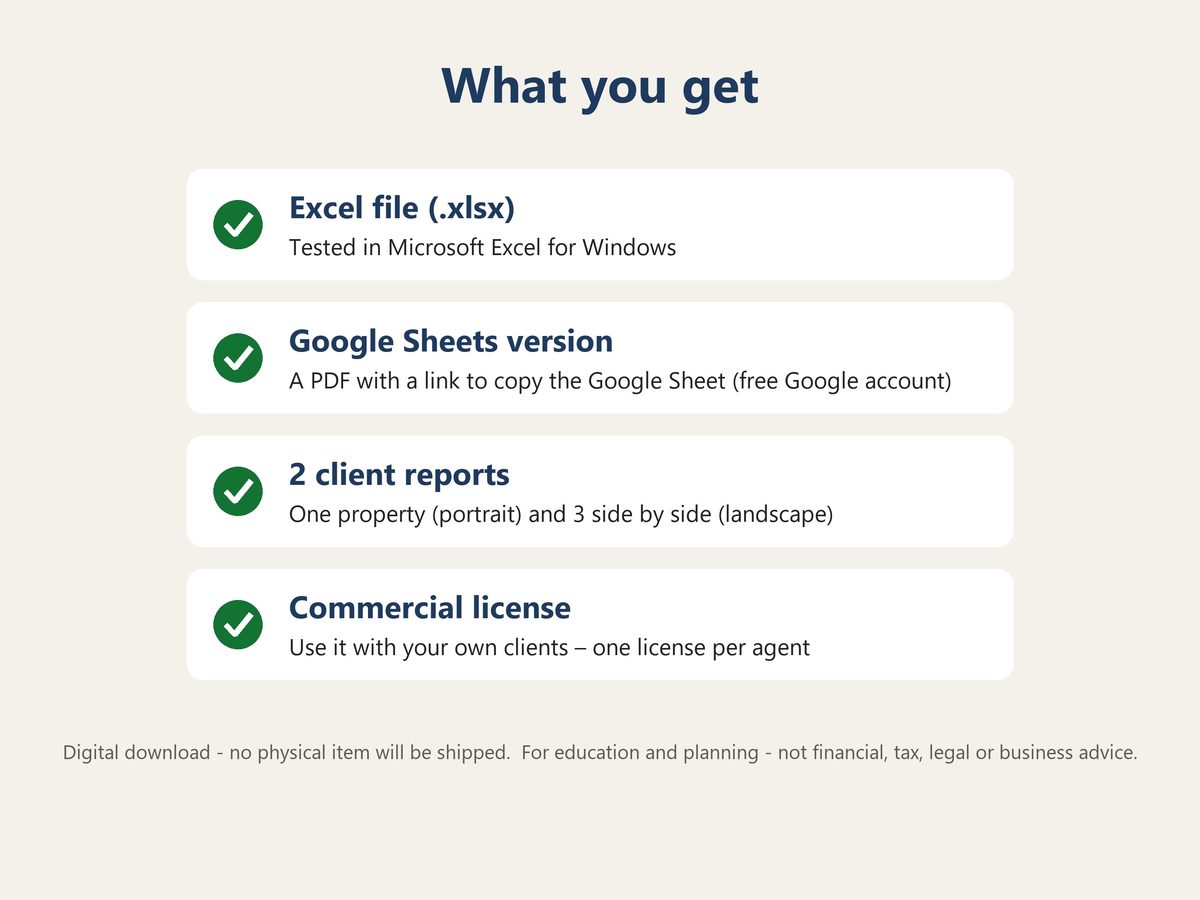
- Single-agent license for client work (commercial use). You may use this file with your own clients: show it on screen, print it, and send PDF copies of the reports with your logo and contact details, also to your client's lender, tax advisor or co-investors.
- Your assistant or transaction coordinator may use it for your clients, and you may show it to your managing broker for review. You may keep it on all your own devices, save a copy for each deal, change it for your own use, use it for your own investments, keep using it if you move to another brokerage, and use reports you made with it in your own marketing (take the client's name off first).
- You may not resell or share the editable file, including a link to it, with clients, other agents or anyone else. Each agent on a team needs their own license.
WHAT YOU GET
- Excel file (.xlsx), tested in Microsoft Excel for Windows
- Google Sheets version: a PDF with a link to copy the Google Sheet (use this one on a Mac)
- Start Here tab: step-by-step instructions, how to add your logo and send a PDF, and the plain-English meaning of every number (see photo 4)
- 3 example properties to show how it works (replace them with your own numbers)
GOOD TO KNOW
- This is a digital download. Nothing will be shipped.
- Made for US properties. Amounts are in US dollars.
- Use a computer (Windows or Mac) to add your logo and save the PDFs. It was not tested on an iPad or phone.
- Results are before income tax. Depreciation and tax savings are not included.
- DSCR is shown as NOI divided by principal and interest. Lenders calculate DSCR differently, so check with the lender.
- Insurance: include any flood, wind or hail coverage the property needs.
- Only the yellow cells can be changed, so the formulas are hard to break by accident.
- For education and planning only. This is not financial, tax, legal or investment advice.
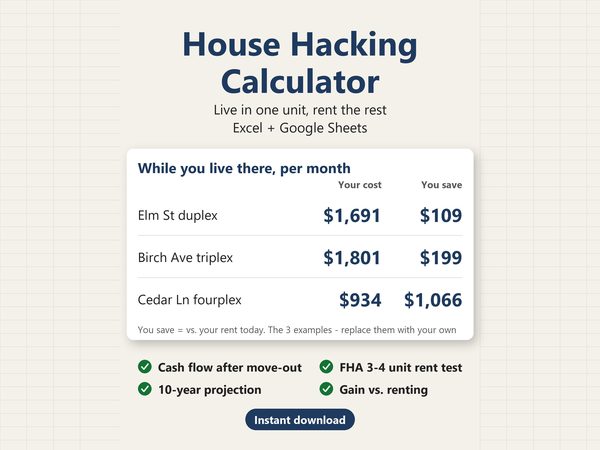
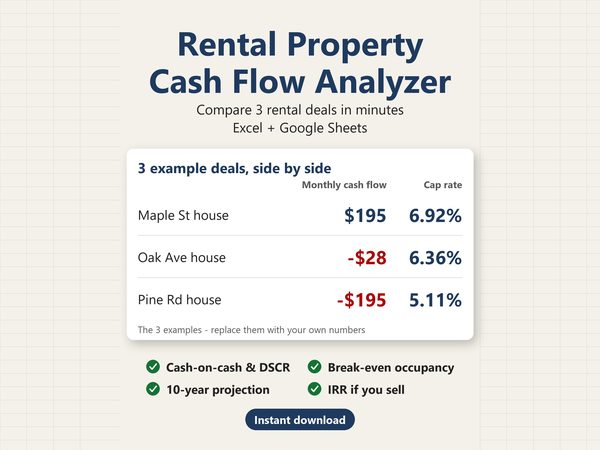
- Investing for yourself and don't need client reports? The Rental Property Cash Flow Analyzer in our shop has the same calculations for personal use.
ABOUT THIS TEMPLATE
Designed by SlateTally with the help of AI tools. Every result was checked in Microsoft Excel against an independent calculation, including unusual inputs such as a 0% interest rate, 100% vacancy, an empty agent section, a very long brokerage name, the longest note and disclaimer, and properties held for different years. In Excel, both reports were saved as PDF and each fits on one US Letter page. The Google Sheets version was checked cell by cell against the Excel file, and from Google Sheets both reports also download as a one-page US Letter PDF.
Questions? Send a message – happy to help.